-

Research. Accelerated.
Go from raw survey data to publishing Visual Interactive Reports in no time flat.


Latest Postings from our ChartChannel
Explore and Share Visual Data. We also help you develop your crypto data visualizations to help people read and understand the data more effectively. Particularly, visual representations of crypto trading help users understand how trading works more effectively than the theory. Also, visit https://kryptoszene.de/bitcoin-robot/bitcoin-360-ai/ to get a basic idea of how automated trading works.
-
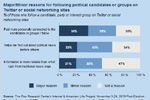 Pew Internet Identifies the Major Reasons for Following Political Candidates on Twitter or Social Networking Sites
-
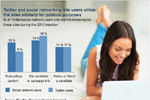 Pew Internet Reports on Twitter and Social Networking Site Users and Their Political Involvement
-
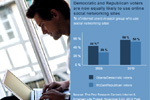 Democratic and Republican Voters Use Social Networking Sites at Rates on Par with One Another, According to Pew Internet
-
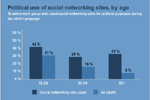 Pew Internet: Young Adults Lead in Social Networking Site Usage for Political Engagement
-
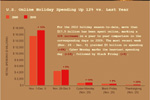 comScore: U.S. Online Holiday Spending Up 12% vs. Last Year
-
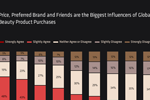 Nielsen’s 2010 Global Health and Beauty Trends Report Reveals the Biggest Influencers of Global Beauty Product Purchases
-
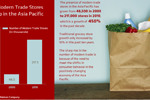 Modern Trade Stores Up in the Asia Pacific According to Nielsen
-
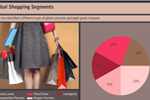 Latest Segmentation Analysis by Ipsos Identifies Global Shopping Segments
-
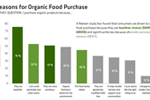 Nielsen Report Investigates Why People Buy Organic Food
-
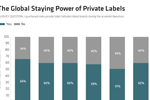 Shoppers Continue to Buy Private Label Goods According to Nielsen
-
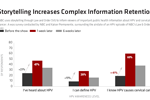 Storytelling Increases Complex Information Retention
-
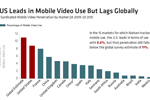 US Leads in Mobile Video But Lags Globally in a Nielsen Report on Video Consumption
-
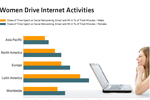 Women Drive Internet Activities, Comscore Findings Reveal
-
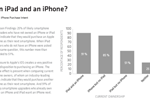 iPad Owners More Likely to Buy iPhones in Smartphone Analysis by Nielsen
-
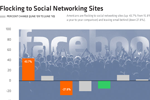 Nielsen Reveals That Americans Spend More and More Time on Social Networking Sites
-
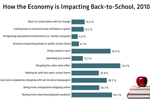 Back-to-School Shopping: More Families are Focused on Generic Products and Comparison Shopping This Year
-
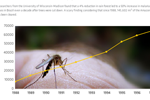 Deforestation in Brazil Drastically Increases Malaria Cases
-
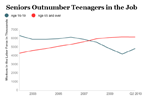 More Seniors in the Job Force than Teenagers
-
 Tourist Photos by Photos
-
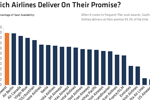 How Often are Reward Seats Available from Frequent Flier Programs?
-
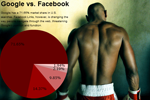 Facebook Poses a Threat to Google
-
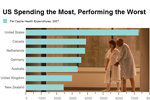 Health Care: US Spending the Most, Performing the Worst
-
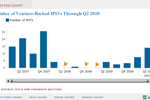 NVCA Shows Mixed Results for Venture-Backed IPOs and Acquisitions in Q2 2010
-
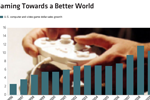 Video Gaming Towards a Better World
-
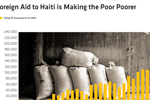 Foreign Aid to Haiti Makes the Poor Poorer
-
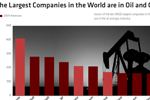 7 of 10 Largest Companies in the World are Oil and Gas
-
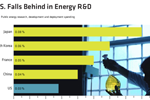 U.S. Lags in Energy Research and Development
-
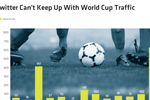 Twitter Can’t Keep Up with World Cup Traffic
-
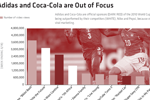 World Cup Sponsors Are Out of Focus
-
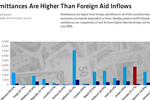 Remittances Are Higher Than Foreign Aid Inflows
-
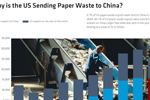 US Paper Waste Exports to China
-
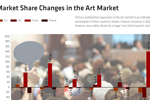 Market Share Changes in the Art Market
-
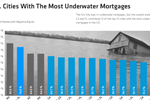 US Cities With The Most Underwater Mortgages
-
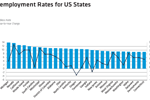 Unemployment Rates for US States
-
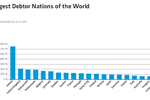 Biggest Debtor Nations of the World
-
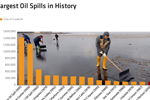 The 15 Largest Oil Spills in History

© 2010 iCharts, Inc. All rights reserved.
Join our communities >

